
Most companies buy company swag on gut feeling. They budget it as a cost, hand it out, and hope something good happens. Almost nobody measures what happens next.
So we ran a proper study instead.
Company swag. Company merch. Corporate swag. Branded merchandise. Employee swag. Different names for the same thing, and the name matters a great deal less than the question nobody asks: does any of it do anything measurable to your employees and your customers?
Sunday partnered with NMBS/SNCB (the Belgian national railway company, roughly 18,000 employees and one of the most recognised brands in Belgium), independent research agency Sapience, and the Vrije Universiteit Brussel (VUB) to run a benchmarked scientific study on what branded company clothing actually does to a brand. Not what it feels like it does. What the numbers say.
To our knowledge, this is the first study to measure a single company's merchandise programme against that same company's own employee engagement survey and brand tracker, capturing the HR effect and the marketing effect of one programme at the same time.
The short version: company swag is not a cost line. It is a media channel, an employee engagement lever and an employer branding tool at the same time, and it is measurable on all three.
Here is the full study, the methodology, the raw numbers, the limitations, and what to do with it.
In short: a 2023 study of 258 people, run by research agency Sapience with the Vrije Universiteit Brussel for the Belgian railway company NMBS and merch platform Sunday, found that employees who received branded company swag scored 19% higher on engagement, 21% higher on satisfaction and 26% higher on ambassadorship than the company's own benchmark. Among customers, brand image rose 4.4% and Net Promoter Score moved from -27 to +1. 84% of people who wore the clothing were spoken to about it by someone else, and 94% of those conversations were positive. The effect was strongest when the logo was visible and when the item was actually worn.
Key findings at a glance
| Metric | Control / benchmark | Company swag group | Change |
|---|---|---|---|
| Employee engagement (0 to 10) | 7.0 | 8.3 | +19% |
| Employee satisfaction (0 to 10) | 6.6 | 8.0 | +21% |
| Ambassadorship (engagement sub-factor) | 6.6 | 8.3 | +26% |
| Overall brand image (1 to 5) | 3.20 | 3.34 | +4.4% |
| "Sympathetic and friendly" (brand image sub-factor) | 3.2 | 3.6 | +12.5% |
| Net Promoter Score | -27 | +1 | +28 points |
| Wearers addressed by others about their clothing | n/a | 84% | n/a |
| Share of those reactions that were positive | n/a | 94% | n/a |
| Extra people reached per wearer, per wearing moment | n/a | 1.6 to 3.2 | n/a |
One sentence to remember: in this study, every single person who wore a piece of company swag started an average of 1.6 to 3.2 conversations about the brand, and 94% of those conversations were positive.
Why we ran a study on company swag
Sunday designs, produces and logistically manages company merch for brands across Europe. The whole premise of what we do is that branded clothing creates ambassadors: employees who talk more warmly about their employer, and customers who become walking, visible advocates.
That premise had a problem. It was a belief, not a measurement.
The branded merchandise industry has a long tradition of measuring inputs (units ordered, cost per piece, delivery times) and almost no tradition of measuring outputs (conversations started, engagement moved, brand perception shifted). If you cannot show the output, merch stays a marketing afterthought that gets cut in the first budget round.
So we set two objectives:
- Quantify the HR effect. Does company swag move employee engagement and satisfaction, and if so, which sub-factors?
- Quantify the marketing effect. Does company merch move brand image, Net Promoter Score and word of mouth among customers?
NMBS was the ideal partner. It is a large, well-known brand with existing, professionally measured benchmarks for both employee engagement and public brand perception, which meant we could compare the company swag group against a real baseline instead of against nothing.
What makes this a scientific study and not a vendor survey
The branded merchandise industry is full of statistics that fall apart the moment you ask where they came from. Before the numbers, here is why these ones hold up.
It was run by independent researchers, not by us. Sunday commissioned the study and Sunday sells company swag. That is a conflict of interest, and the way you handle a conflict of interest is to hand the work to someone else. The design, fieldwork and analysis were carried out by Sapience, an independent research agency in Ghent, Belgium. We did not write the questions, run the fieldwork or analyse the data. We could not have tilted the result if we had wanted to.
It was measured against real pre-existing benchmarks. This is the part that separates a study from a testimonial. Every headline number is a comparison against NMBS's own professionally run population research: the "We Are NMBS 2019" employee engagement survey and the "Train Monitor 2022" brand tracker. These instruments existed before the study, were built for other purposes, and were not designed to flatter merchandise. Most merchandise research compares happy customers against nothing at all.
The population was defined, not cherry-picked. The survey went to the full list of roughly 1,600 people who acquired the 2022 collections. We did not select favourable respondents, and we did not stop collecting when the numbers looked good.
Differences were significance-tested. The brand image gains reported below are marked as statistically significant against the benchmark. Where a difference was not significant, we do not present it as a finding.
The limitations are published alongside the results. There is a full section below on what this study cannot prove, including the self-selection problem and the small sub-group bases. A study that only reports its wins is marketing wearing a lab coat.
It was an academic collaboration. The study was run jointly with the Vrije Universiteit Brussel (VUB), alongside Sapience and NMBS. Academic involvement is what keeps a commercially motivated question honest: it puts people in the room whose professional incentive is methodological rigour rather than a favourable headline.
How this differs from existing industry research
We are not claiming nobody has studied branded merchandise before. Plenty have, and the good ones are worth reading.
The large industry studies, such as ASI's Ad Impressions Study covering roughly 25,000 consumers and PPAI's consumer research, measure recall, impressions and purchase intent across a broad consumer panel. Academic work from the University of Texas at San Antonio and the University of Missouri has examined how promotional items affect brand image and purchase intent. That body of work establishes that merchandise does something.
What it does not do is connect the effect to a single organisation's own internal data. Our study takes a different approach in three specific ways:
- It measures HR and marketing effects of the same programme simultaneously. Most research looks at consumers or at employees, not both sides of one merchandise programme.
- It benchmarks against the client's own pre-existing instruments. The comparison is NMBS employees versus NMBS's own engagement survey, and NMBS clothing buyers versus NMBS's own brand tracker, rather than a general consumer panel with no organisational context.
- It studies merchandise that was sold, not given away. Nearly all existing research measures free promotional items. NMBS charged for this collection, which makes the economics fundamentally different and, as it turns out, does not weaken the effect.
That combination is what we believe is new here. We would rather make a narrow claim we can defend than a broad one we cannot.
Methodology: how the study was actually run
We are publishing the method in full, because a statistic without a method is just a nice-looking number.
Who ran it. The research design, fieldwork and analysis were carried out by Sapience, an independent research agency based in Ghent, Belgium, in collaboration with the Vrije Universiteit Brussel (VUB). Sunday and NMBS commissioned the study. Sunday did not run the fieldwork or the analysis.
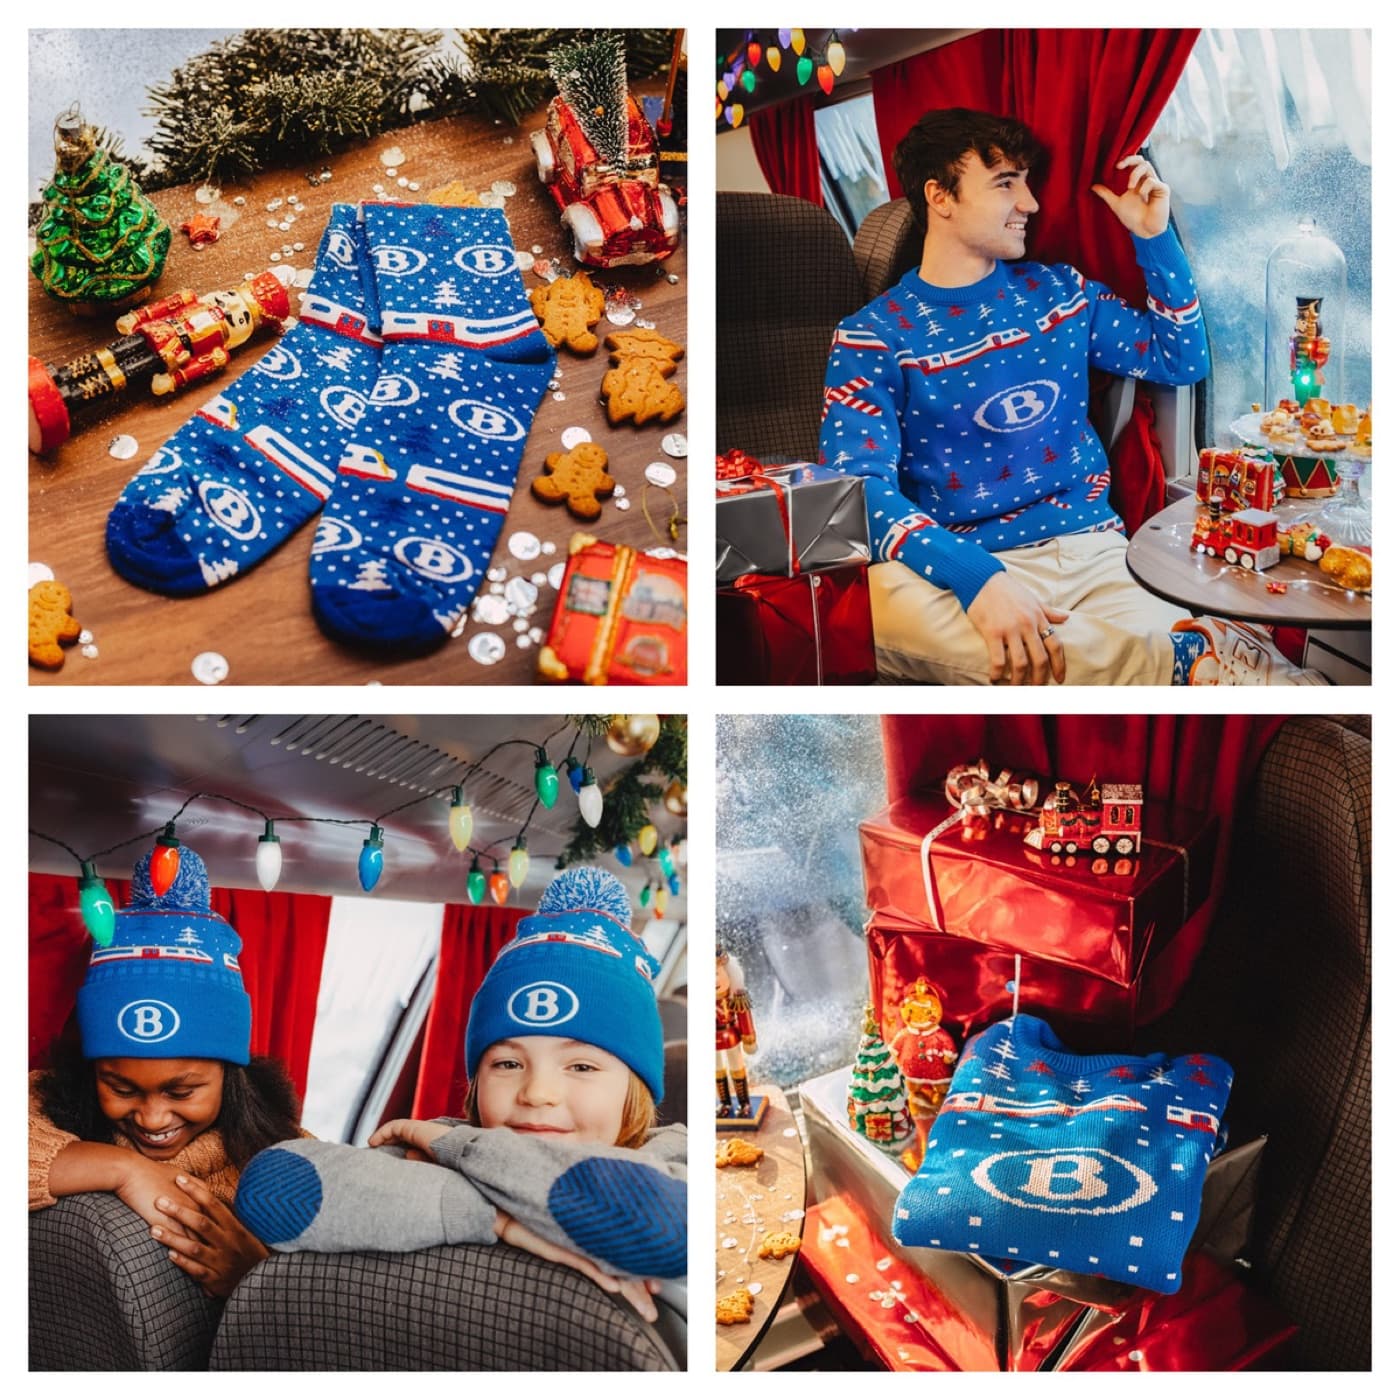
Population. NMBS sold a summer 2022 and a winter 2022 company swag collection: t-shirts, sweaters, Christmas sweaters, socks, Christmas socks, bags, banana bags, sun hats and Christmas hats. The collection was available to both NMBS employees and external buyers (members of the public and NMBS customers). Note that this was not free merchandise. People paid for it.
Sampling. The survey was distributed by NMBS to approximately 1,600 people who had acquired one or more pieces from the 2022 summer and/or winter collection.
Fieldwork. Online survey, conducted between 18 and 31 January 2023.
Sample size. 240 people completed the full survey: 72 NMBS employees and 168 external buyers. A further 18 people completed the survey partially and were included in the analysis to capture maximum feedback, bringing the total analysed sample to 258. Analysis bases vary per question: n=258 total, n=218 for people who had already worn the clothing, n=76 for the NMBS employee analysis, n=169 for the external buyer analysis.
Survey structure. Four blocks: (1) purchase and usage behaviour of the company swag, (2) NMBS HR KPIs, (3) NMBS marketing KPIs, (4) respondent profiling.
Benchmarks. This is the part that makes the study worth reading.
- Employee results were benchmarked against "We Are NMBS 2019", NMBS's own organisation-wide employee engagement survey covering the general NMBS population.
- Marketing results were benchmarked against the "Train Monitor 2022", the standing brand and satisfaction tracker for the general NMBS customer population.
In other words, the company swag group was not compared to a hunch. It was compared to the same brand's own professionally measured population data, using comparable question wording.
Finding 1: Company swag is a conversation engine
Start with the most basic question in all of branded merchandise: does anyone actually notice?
Yes. Overwhelmingly.
Usage first. 86% of people who acquired the clothing had already worn it. 9% had not, and 5% had bought it for someone else. Results were similar for NMBS employees and external buyers, which matters: it means the effect is not just internal enthusiasm.
But the interesting part is the breakdown by item, because this is the closest thing the study produced to a shopping list.
| Item | Base | Worn 2+ times | Worn 1-2 times | Never worn |
|---|---|---|---|---|
| Bag | n=13 | 69% | 15% | 15% |
| Sweater | n=67 | 67% | 22% | 10% |
| Christmas socks | n=50 | 66% | 16% | 18% |
| T-shirt | n=75 | 59% | 28% | 13% |
| Sun hat | n=9 | 56% | 33% | 11% |
| Christmas sweater | n=75 | 55% | 40% | 5% |
| Banana bag | n=26 | 54% | 27% | 19% |
| Christmas hat | n=17 | 41% | 47% | 12% |
| Plain socks | n=26 | 50% | 19% | 31% |
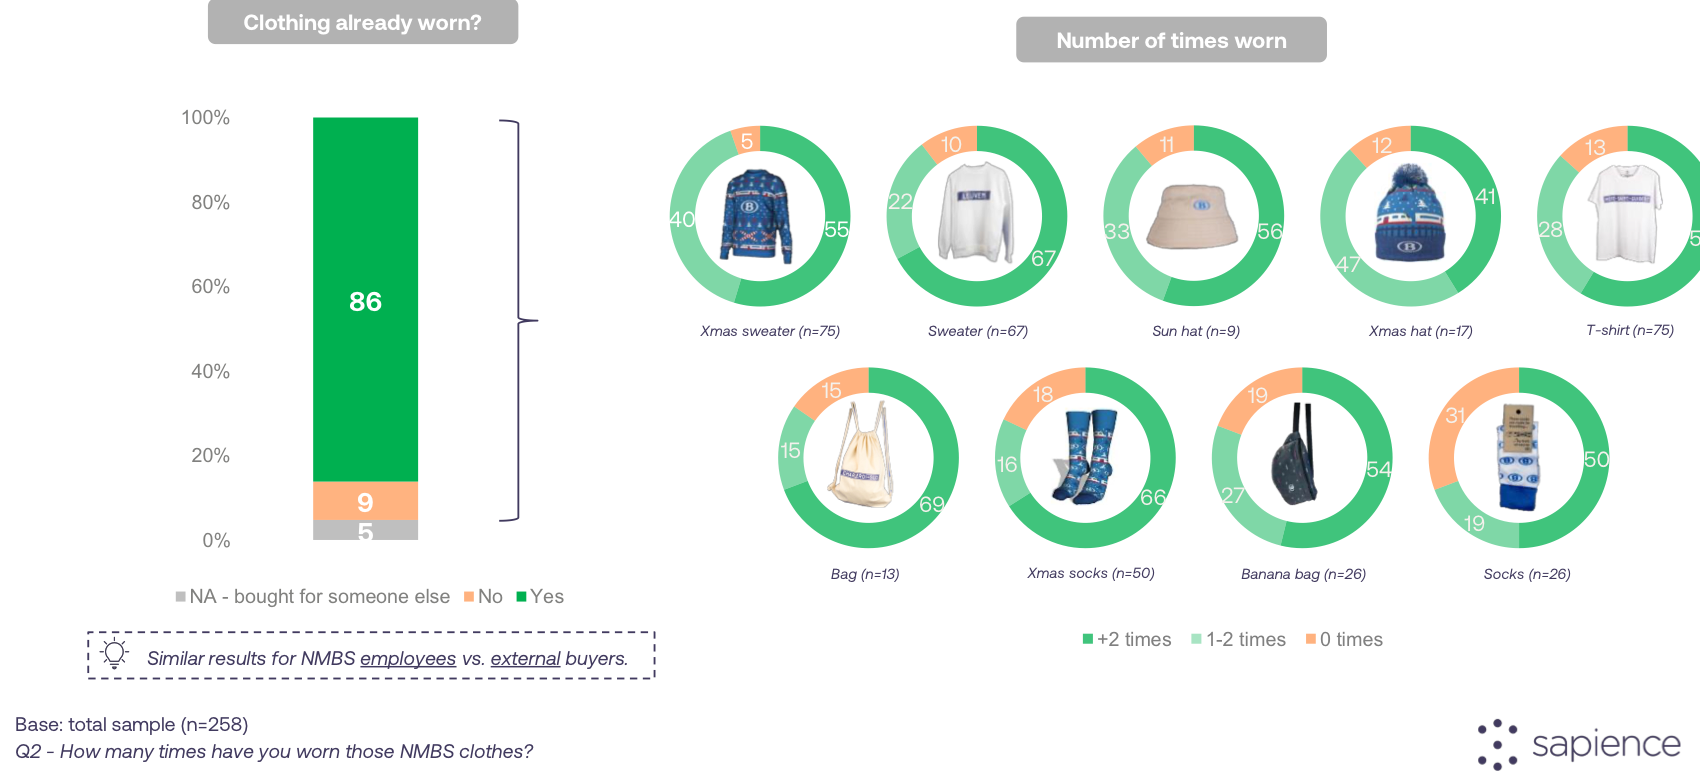
Original chart from the Sapience research report. Base: total sample, n=258.
Two things jump out of the wear-rate data.
Bags and sweaters win. The bag was worn more than twice by 69% of the people who had one, and the plain sweater by 67%. These are the items people integrate into normal life rather than saving for company occasions.
Plain socks lose twice over. They have the worst never-worn rate in the collection at 31%, nearly double the average. And they are the one item Sapience excluded from "branded visible clothing" because the logo cannot be seen. So socks fail on wear rate and they fail on visibility. If you are choosing between a €6 pair of socks and a €35 sweater on unit cost alone, this table is the argument against it.
The Christmas sweater is worth a note too. It has the lowest never-worn rate in the entire collection at 5%, which is remarkable, but a lower repeat rate, because it is seasonal. Almost everyone wears it. Nobody wears it in June.
Then the reach. Among the 218 respondents who had already worn their NMBS clothing:
- 79% were addressed about it by multiple people
- 5% were addressed by one person
- 17% were not addressed at all
That is 84% of wearers who were spoken to by someone else because of what they were wearing.
Then the sentiment. Of those conversations:
- 46% were described as exclusively positive
- 48% were described as mainly positive
- The remaining reactions were mostly neutral, with negative reactions close to zero
94% of all reactions were positive.
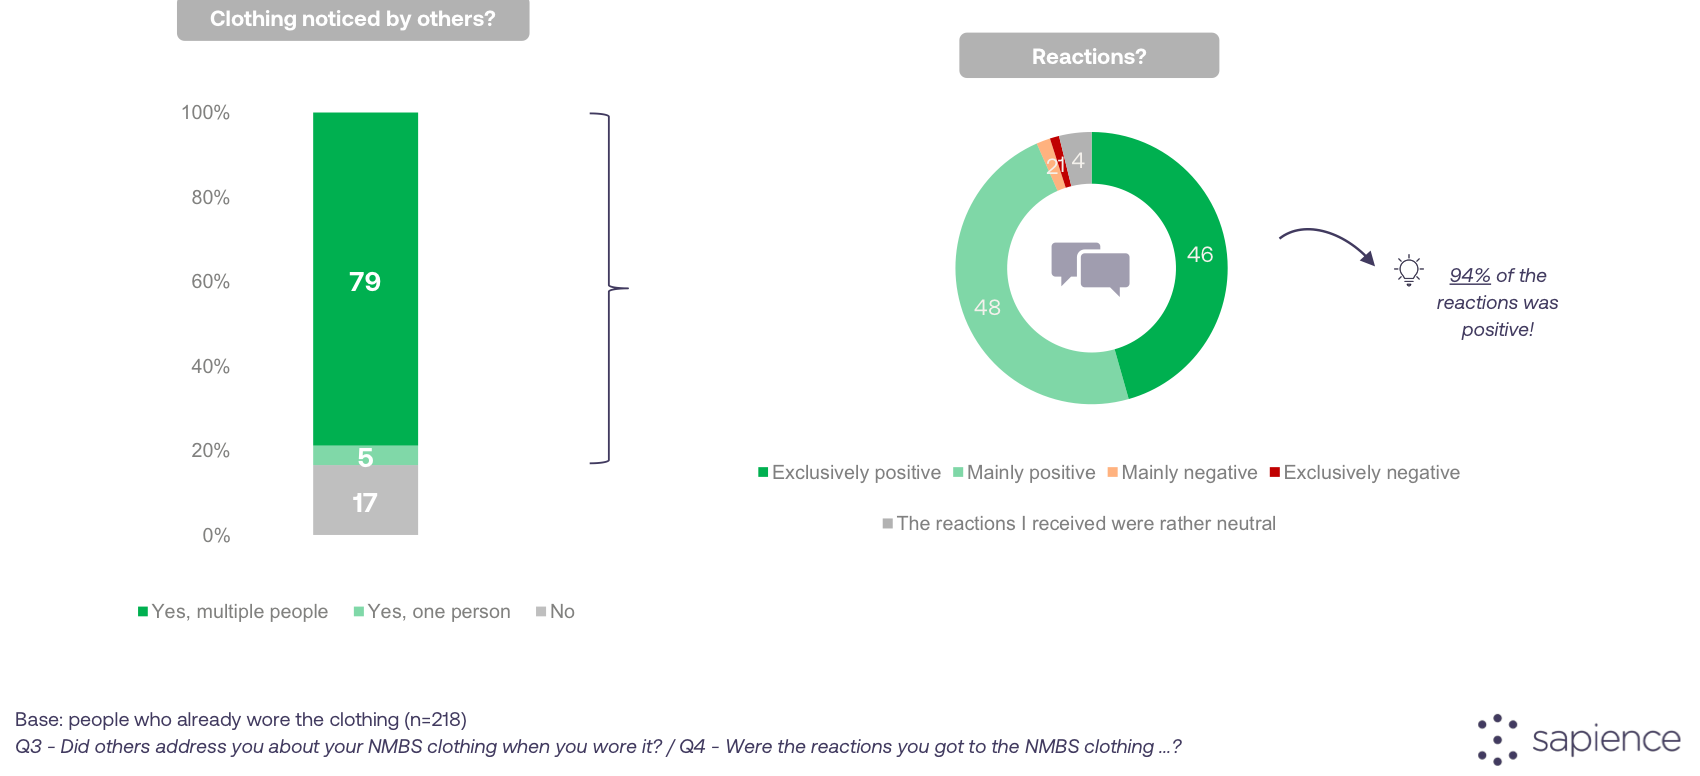
Original chart from the Sapience research report. Base: people who had already worn the clothing, n=218.
The reach maths
Here is how the reach figure is derived, so you can check it yourself.
If 79% of wearers were addressed by "multiple people" (conservatively 2 to 4 people) and 5% were addressed by exactly one person:
- Low estimate: (0.79 × 2) + (0.05 × 1) = 1.63 people per wearer
- High estimate: (0.79 × 4) + (0.05 × 1) = 3.21 people per wearer
So every person who wears a piece of company swag reaches an extra 1.6 to 3.2 people, per wearing moment, in a conversation they did not have to pay for, script or schedule. Among the wearers who were actually addressed, the typical number of people involved was 2 to 4.
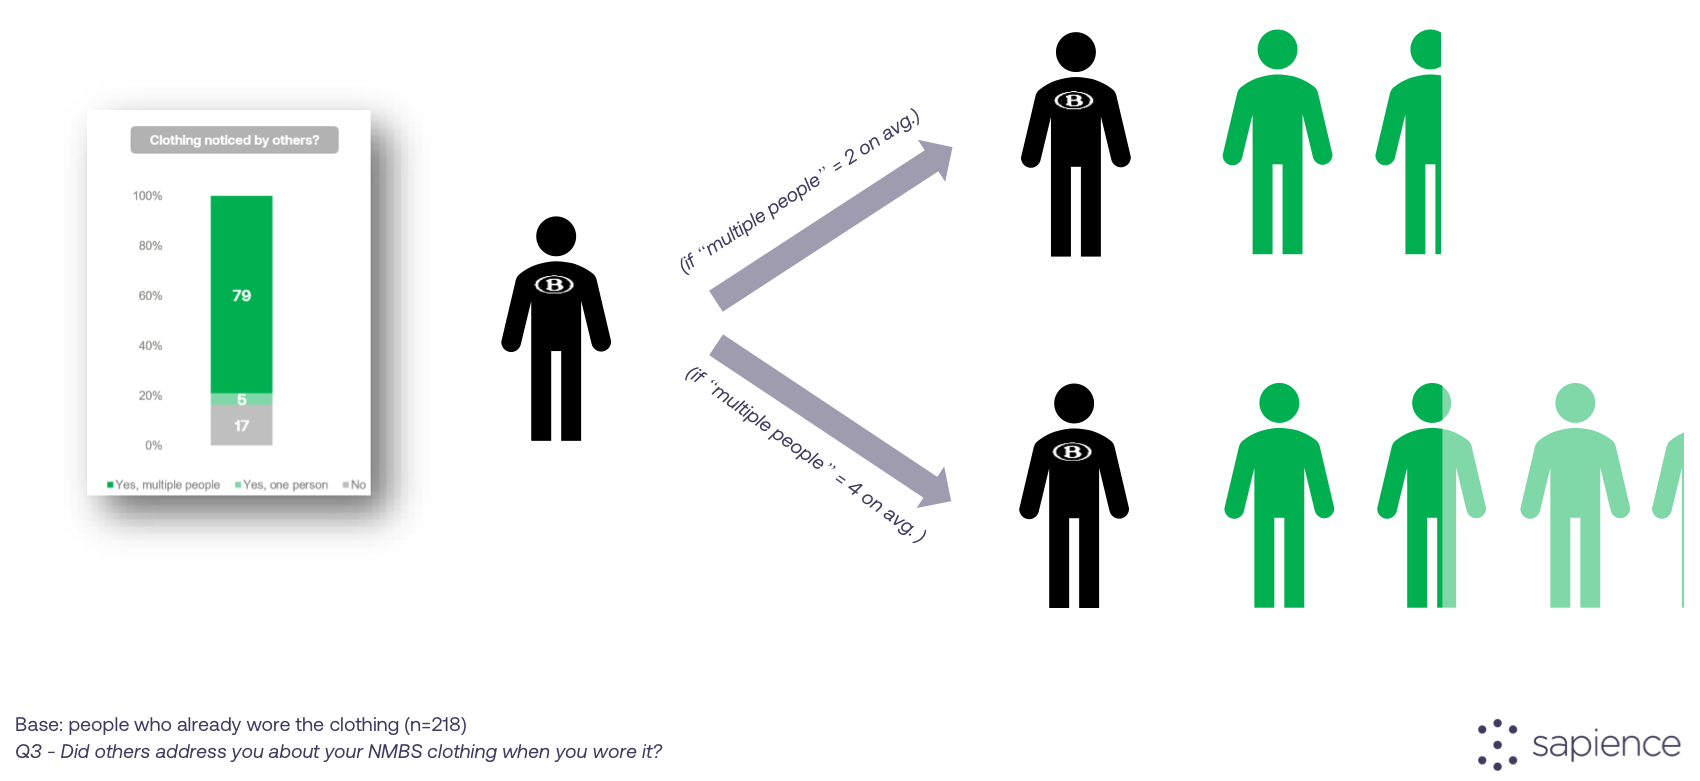
Original chart from the Sapience research report, showing the reach calculation.
Now multiply that. A 500-piece collection, worn twice a month, is somewhere between 1,600 and 3,200 brand conversations per month. At a 94% positive rate. With no media spend attached.
This is the finding people underestimate most. Company swag is not a gift. It is distributed earned media, and the distribution nodes are people who already like you.
Finding 2: Company swag moves employee engagement, and ambassadorship most of all
This is where the HR case gets serious.
Comparing NMBS employees who acquired company swag (n=76) against the "We Are NMBS 2019" benchmark for the general NMBS employee population:
| HR KPI | Benchmark (general NMBS population) | Company swag group | Change |
|---|---|---|---|
| Engagement | 7.0 | 8.3 | +19% |
| Satisfaction | 6.6 | 8.0 | +21% |
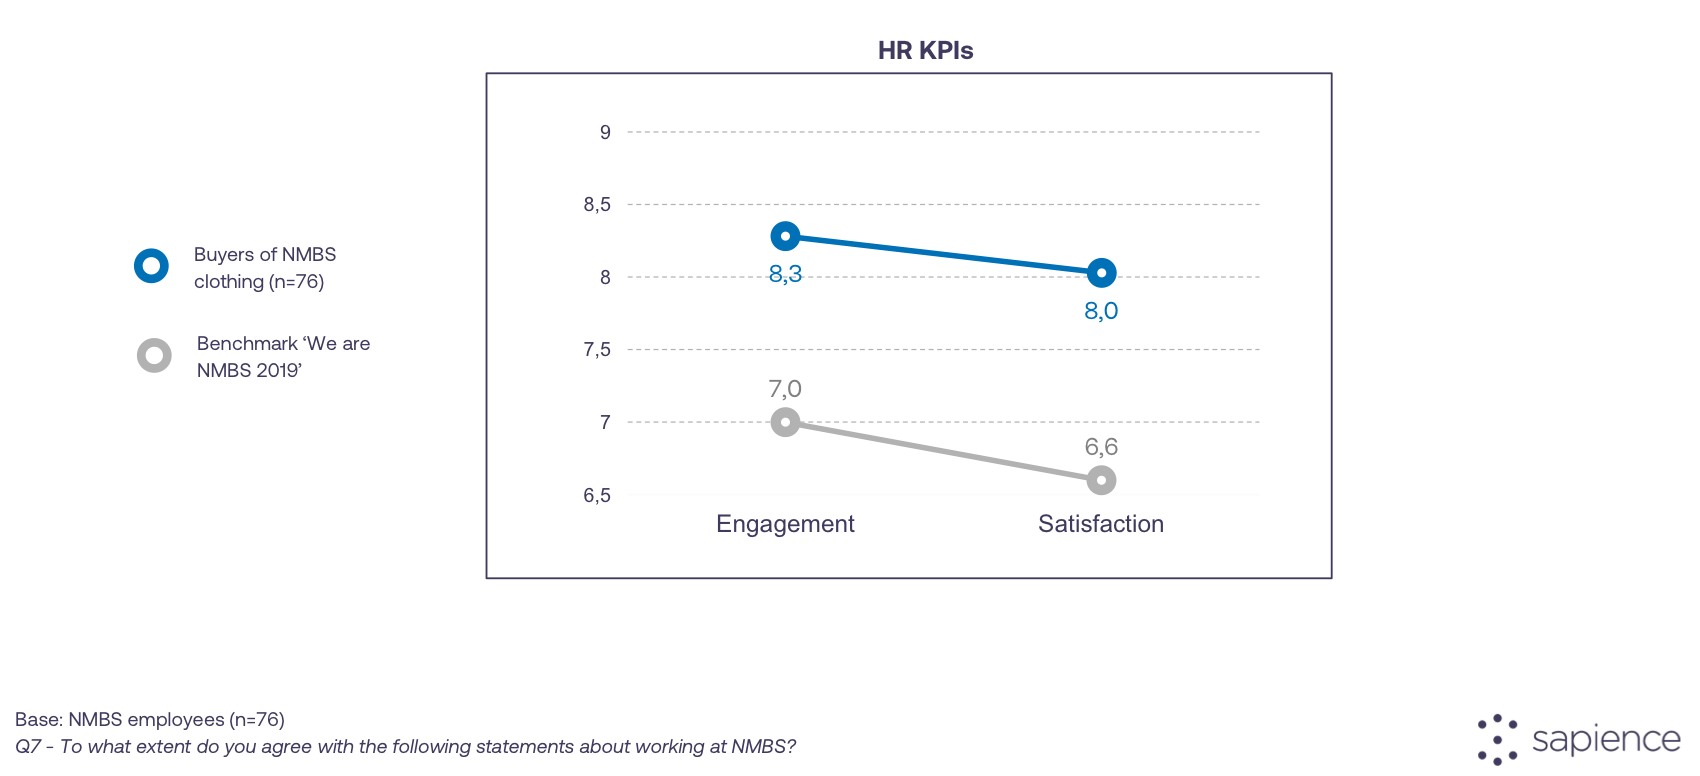
Original chart from the Sapience research report. Base: NMBS employees, n=76.
A 1.3-point lift on engagement and a 1.4-point lift on satisfaction, on a 10-point scale, is not a rounding error. In employee survey terms, those are large gaps.
The sub-factor breakdown
Engagement was measured across five sub-factors: ambassadorship, energy, passion, loyalty and performance. The company swag group scored higher on every single one. No sub-factor went the wrong way.
| Engagement sub-factor | Benchmark | Company swag group | Gap |
|---|---|---|---|
| Ambassadorship | 6.6 | 8.3 | +1.7 |
| Energy | 6.6 | 7.9 | +1.3 |
| Passion | 7.1 | 8.3 | +1.2 |
| Loyalty | 6.9 | 8.0 | +1.1 |
| Performance | 7.9 | 8.9 | +1.0 |
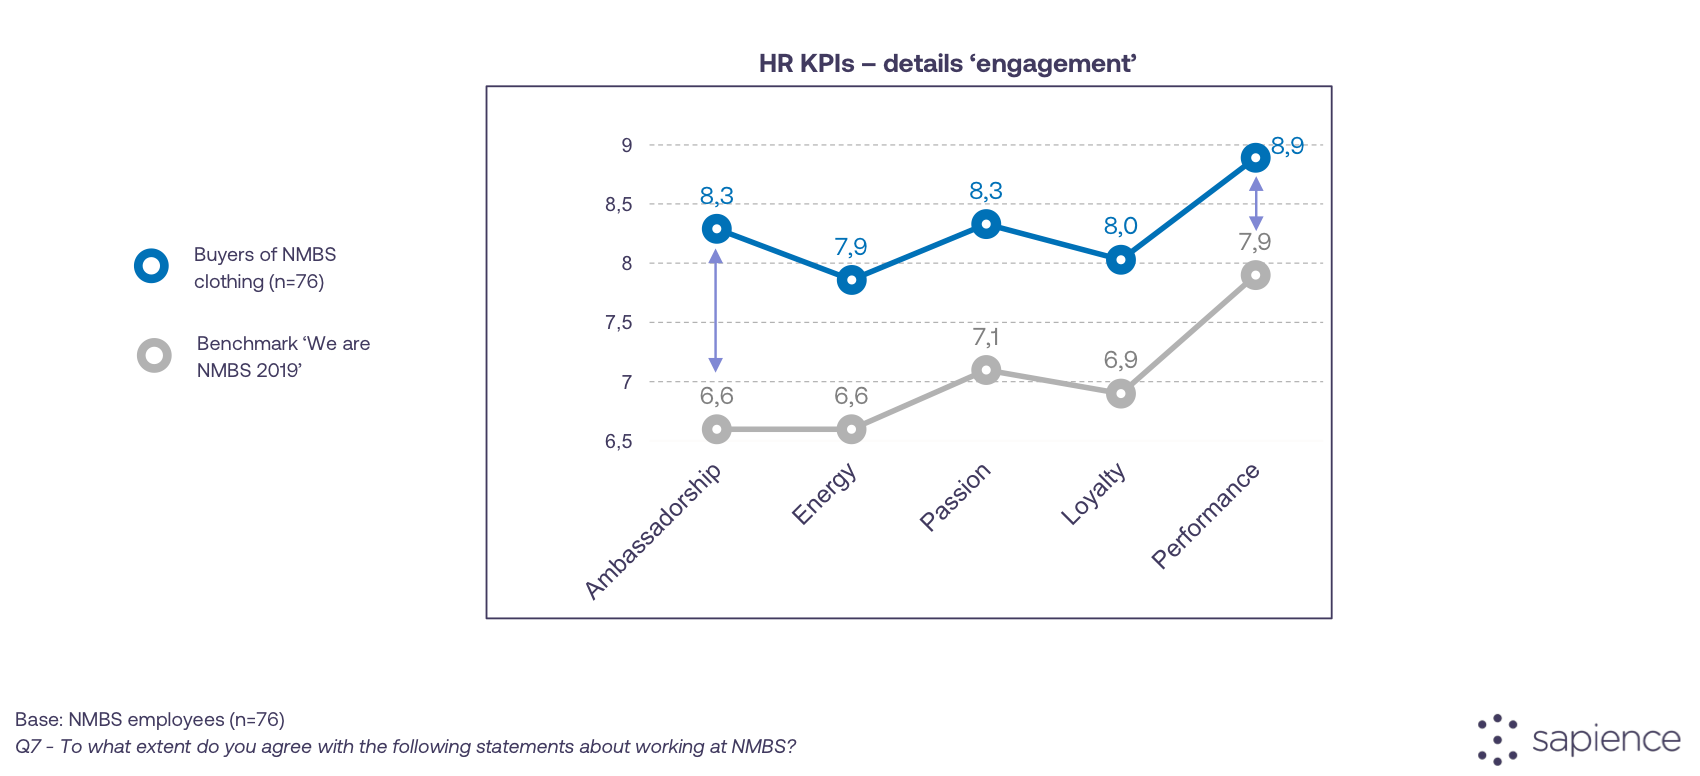
Original chart from the Sapience research report. The ambassadorship gap is the widest of the five.
The largest gap by far was on ambassadorship. NMBS employees who received company swag scored 8.3 on ambassadorship against a 6.6 benchmark, a 26% increase, the biggest single effect measured anywhere in this study.
That is the single most important number in the entire study, and it is worth stating plainly. Ambassadorship, the same idea behind a brand ambassador kit, measures whether an employee speaks positively about their employer to the outside world. Company merch did not just make employees marginally happier in a general sense. It moved the exact behaviour the clothing is designed to produce, and it moved it harder than anything else.
The dose-response signal
Correlation studies get much more convincing when the effect scales with the dose. Ours did, in two independent ways.
By whether the clothing was actually worn.
| Engagement | Satisfaction | |
|---|---|---|
| Wore it already (n=66) | 8.3 | 8.1 |
| Bought it, not yet worn (n=10) | 7.9 | 7.9 |
| Benchmark | 7.0 | 6.6 |
Both groups sit above the benchmark, but NMBS employees who had actually worn their company swag scored 8.3 on engagement against 7.9 for those who owned it but had not yet worn it. Treat this specific comparison with care given the very small non-wearer group.
By whether the clothing was branded and visible. Sapience defined "branded visible clothing" as items carrying the NMBS logo, excluding socks, which are less visible.
| Engagement | Satisfaction | |
|---|---|---|
| Branded, visible items (n=46) | 8.6 | 8.4 |
| Non-branded or non-visible items (n=26) | 8.1 | 7.7 |
| Benchmark | 7.0 | 6.6 |
Read that again, because it has a direct design implication. A 0.7 point satisfaction gap separates NMBS employees who received branded, visible company swag (8.4) from those who received non-branded or non-visible items (7.7). All of them got company swag from the same employer in the same year. The only difference is whether the logo could be seen.
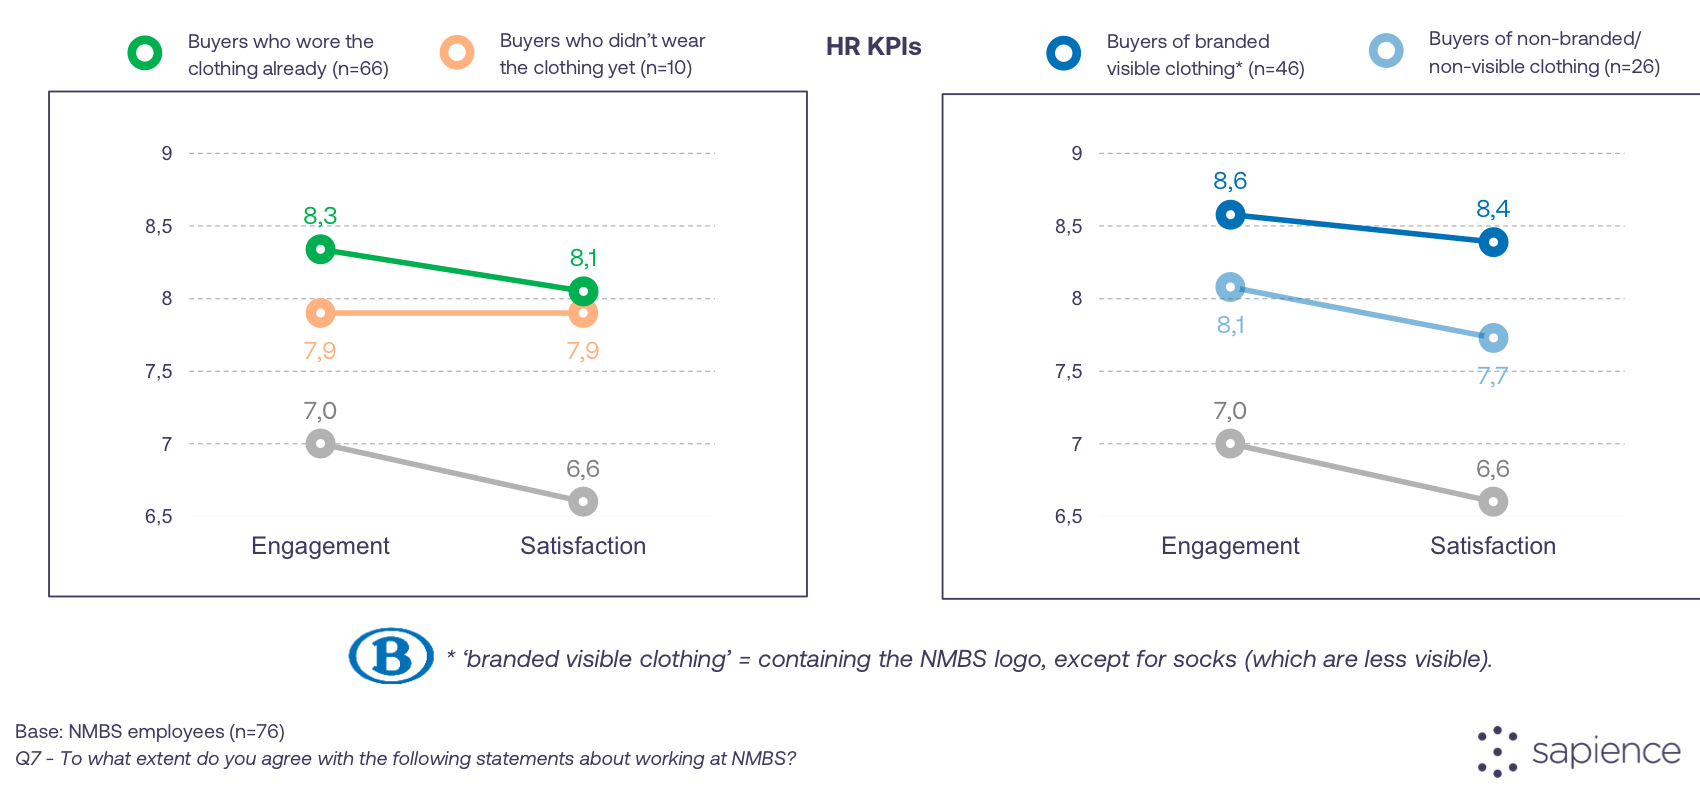
Original chart from the Sapience research report. Both splits point the same way: more exposure, bigger effect.
The logo has to be on it, and it has to be somewhere people can see it. Discreet branding is a wasted opportunity. Socks, however lovely, do not do the same job as a chest logo.
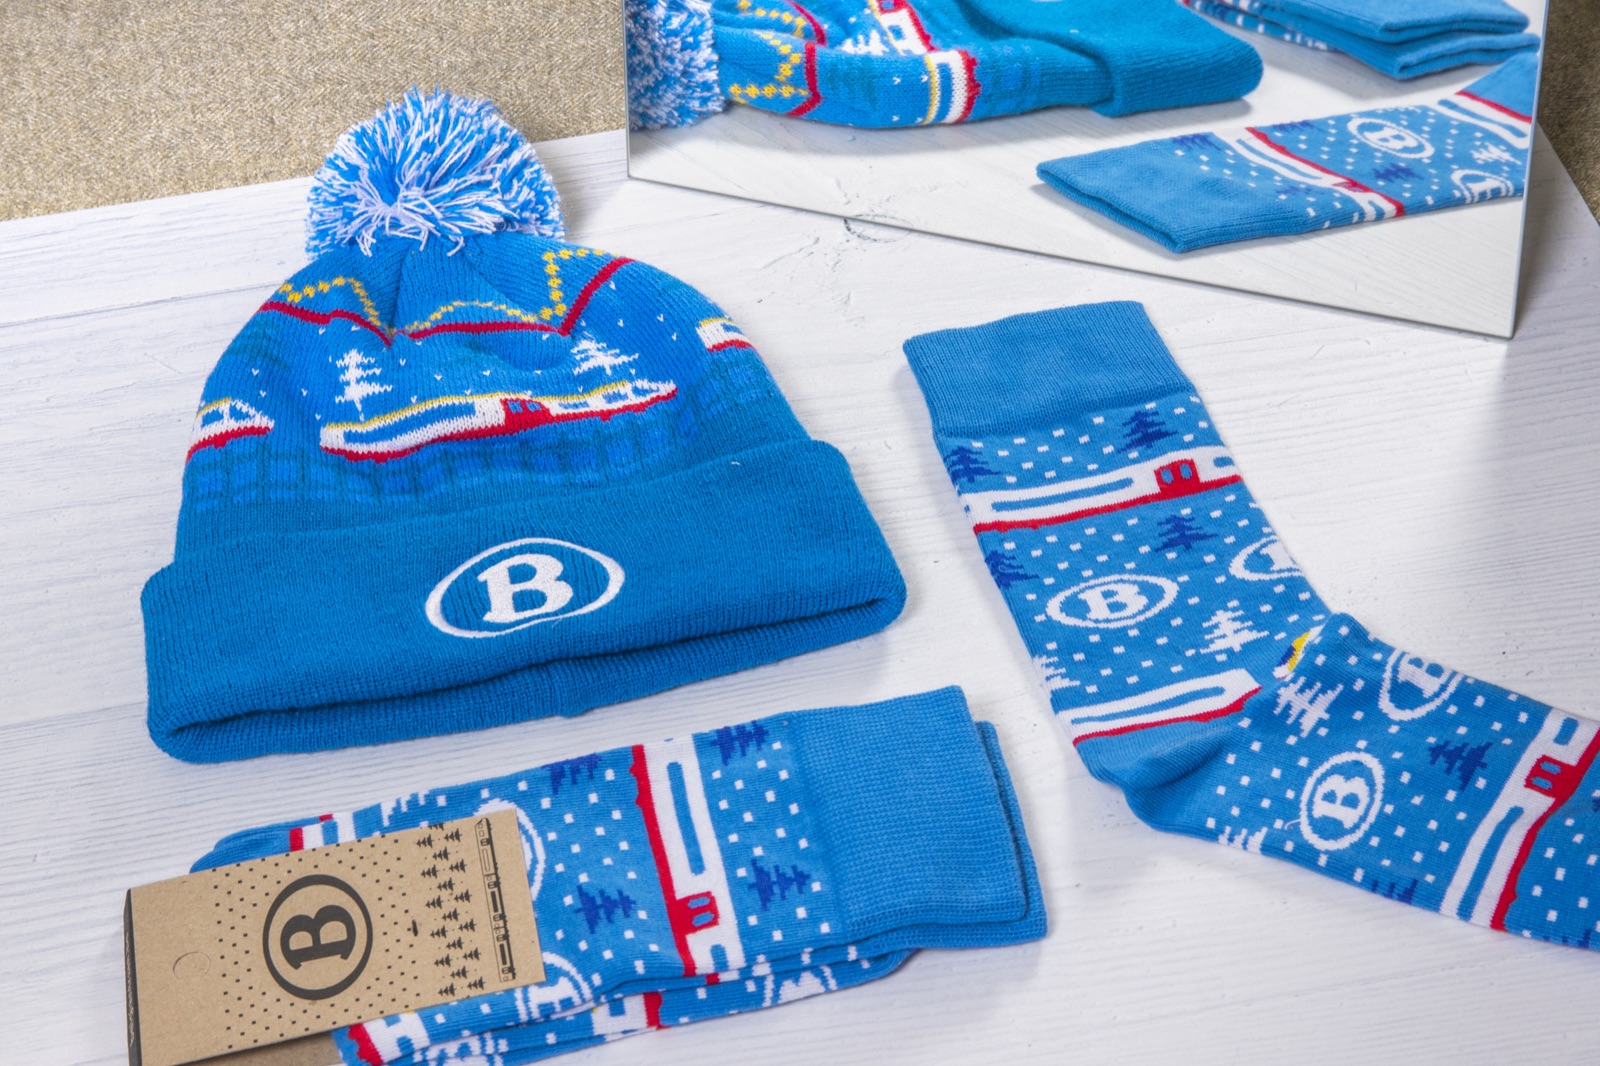
The distinction the study measured, in one photo. The hat carries the logo where people see it. The socks, by Sapience's own definition, do not count as visible branding.
What that is worth in money
The study did not price the engagement lift, so we will be explicit that the following is an industry benchmark and not a study finding: replacing a departed employee typically costs a company between €25,000 and €50,000 when you account for recruitment, onboarding, lost productivity and ramp time.
Engagement and satisfaction are the two most reliable leading indicators of retention that exist. If a company swag programme moves engagement 19% and satisfaction 21% in the group that receives it, and if even a small fraction of that converts into people who stay rather than leave, the programme pays for itself many times over on the HR line alone, before you count a single marketing effect.
Finding 3: Company swag improves how customers see the brand
Now the external side. Comparing external buyers of NMBS clothing (n=169) against the "Train Monitor 2022" benchmark for the general population:
| Marketing KPI | Benchmark (Train Monitor 2022) | External buyers of company swag | Change |
|---|---|---|---|
| Overall brand image (1 to 5) | 3.20 | 3.34 | +4.4%, statistically significant |
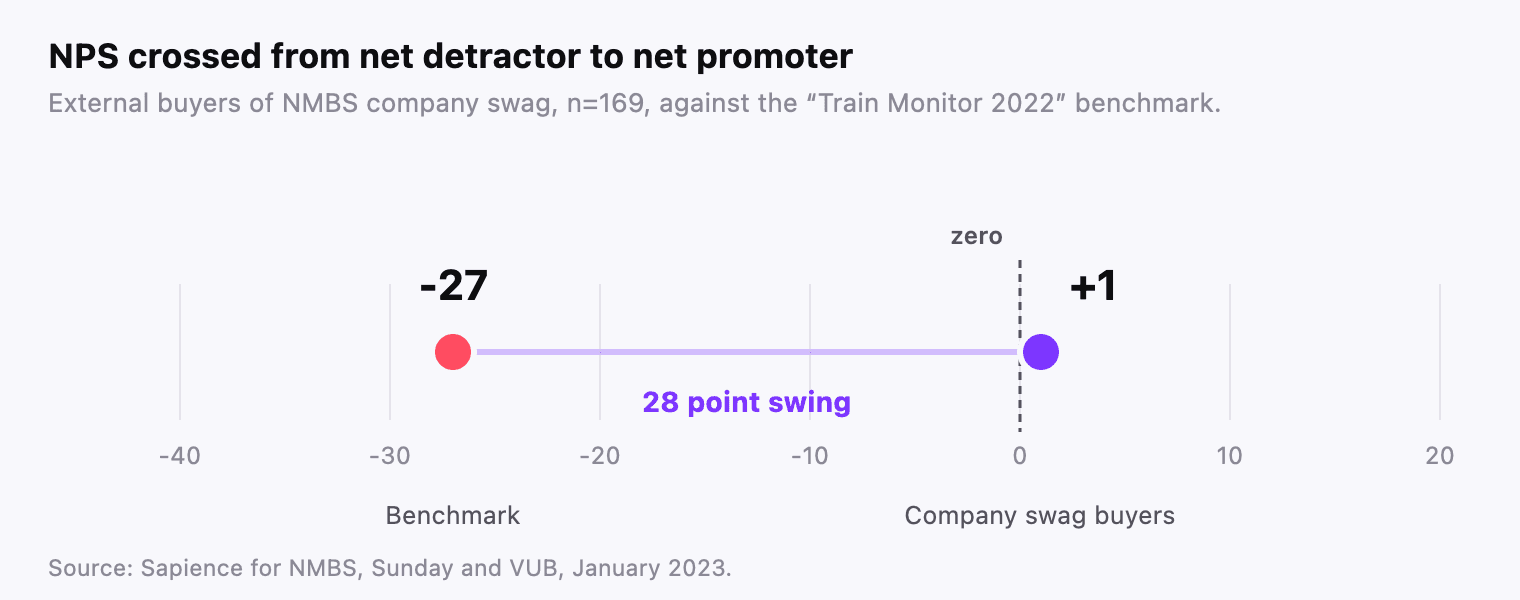
| Net Promoter Score | -27 | +1 | +28 points |
The NPS swing is the headline
NMBS, like most national rail operators in Europe, carries a negative NPS with the general public. Trains are late, people complain, that is the reality of the category.
Among people who bought and wore NMBS company swag, NPS was positive.
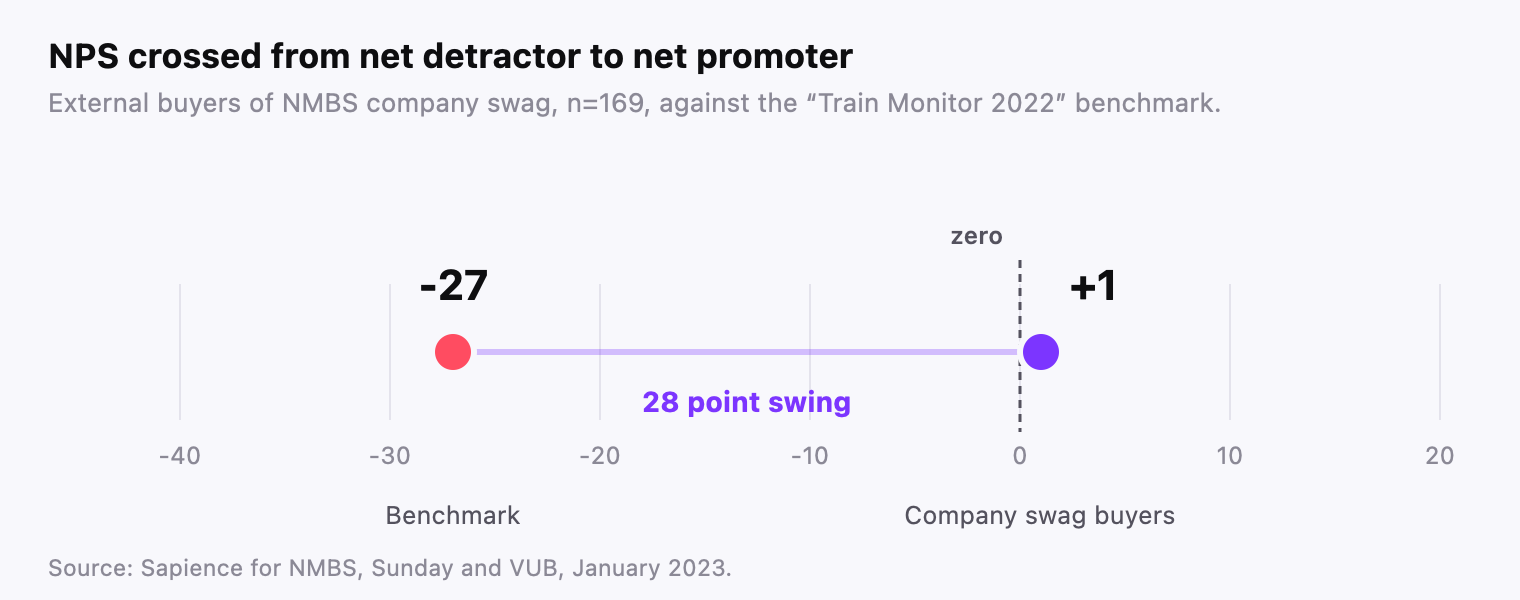
NMBS's Net Promoter Score among external buyers of its company swag was +1, against -27 in the general population benchmark. That 28-point swing crosses the line from a net-detractor to a net-promoter population. For any brand operating in a category where public sentiment is structurally negative, that number should stop you in your tracks.
Where the image gains came from
Brand image was measured across nine attributes, scored out of 5. Four showed statistically significant differences against the benchmark.
| Brand attribute | Benchmark | Company swag buyers | |
|---|---|---|---|
| Sympathetic & friendly | 3.2 | 3.6 | significant |
| Trustworthy | 3.2 | 3.4 | significant |
| Knowledge & expertise | 3.6 | 3.8 | significant |
| Open to all | 3.8 | 4.0 | significant |
| Customer centric | 2.9 | 3.1 | not significant |
| Attractive employer | 3.1 | 3.2 | not significant |
| Sustainable | 3.3 | 3.4 | not significant |
| Dynamic & modern | 3.0 | 3.0 | no difference |
| Efficient & well-organised | 2.8 | 2.7 | no difference |
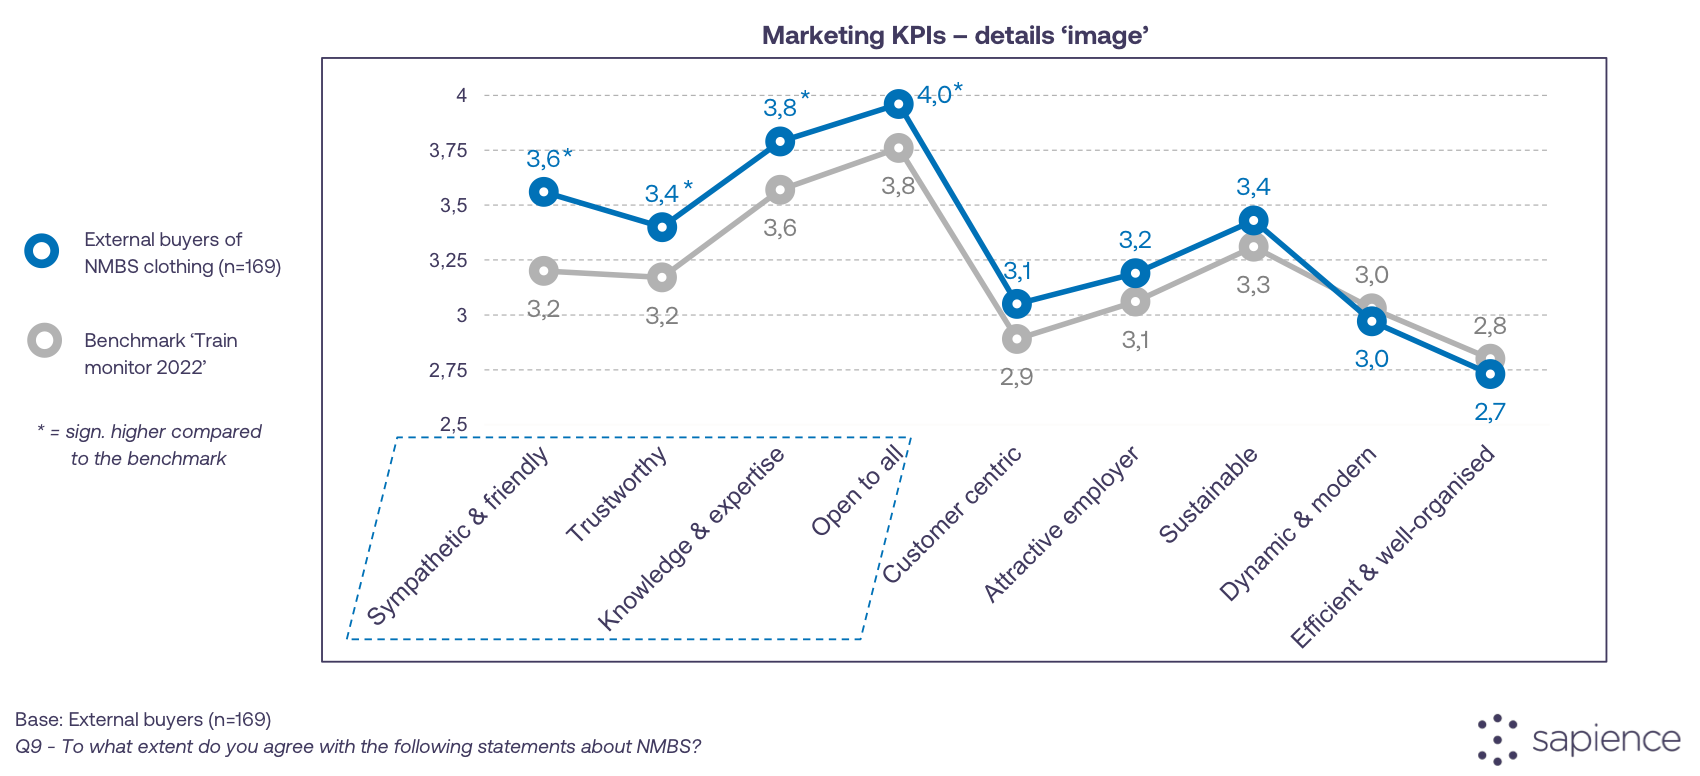
Original chart from the Sapience research report. The four starred attributes are significantly higher than the benchmark.
Note the bottom of that table. NMBS scored 2.7 on "efficient and well-organised" among company swag buyers against a 2.8 benchmark, the one attribute that did not improve. Company swag did not make people think the trains ran on time, and we would not believe the data if it had.
The pattern here is coherent and it is worth naming. Company merch did not primarily make NMBS look more competent, though expertise did move. It made NMBS feel more human. Warmer, friendlier, more trustworthy, more open.
That is exactly what you would expect from a channel that works through people rather than through advertising. A logo on a billboard makes claims. A logo on a person you know creates warmth.
The dose-response signal repeats
The same pattern showed up on the marketing side. The image effect was clearly stronger among external buyers who had already worn the clothing (n=146) than among those who had bought it but not yet worn it (n=23), whose scores sat closer to the general benchmark.
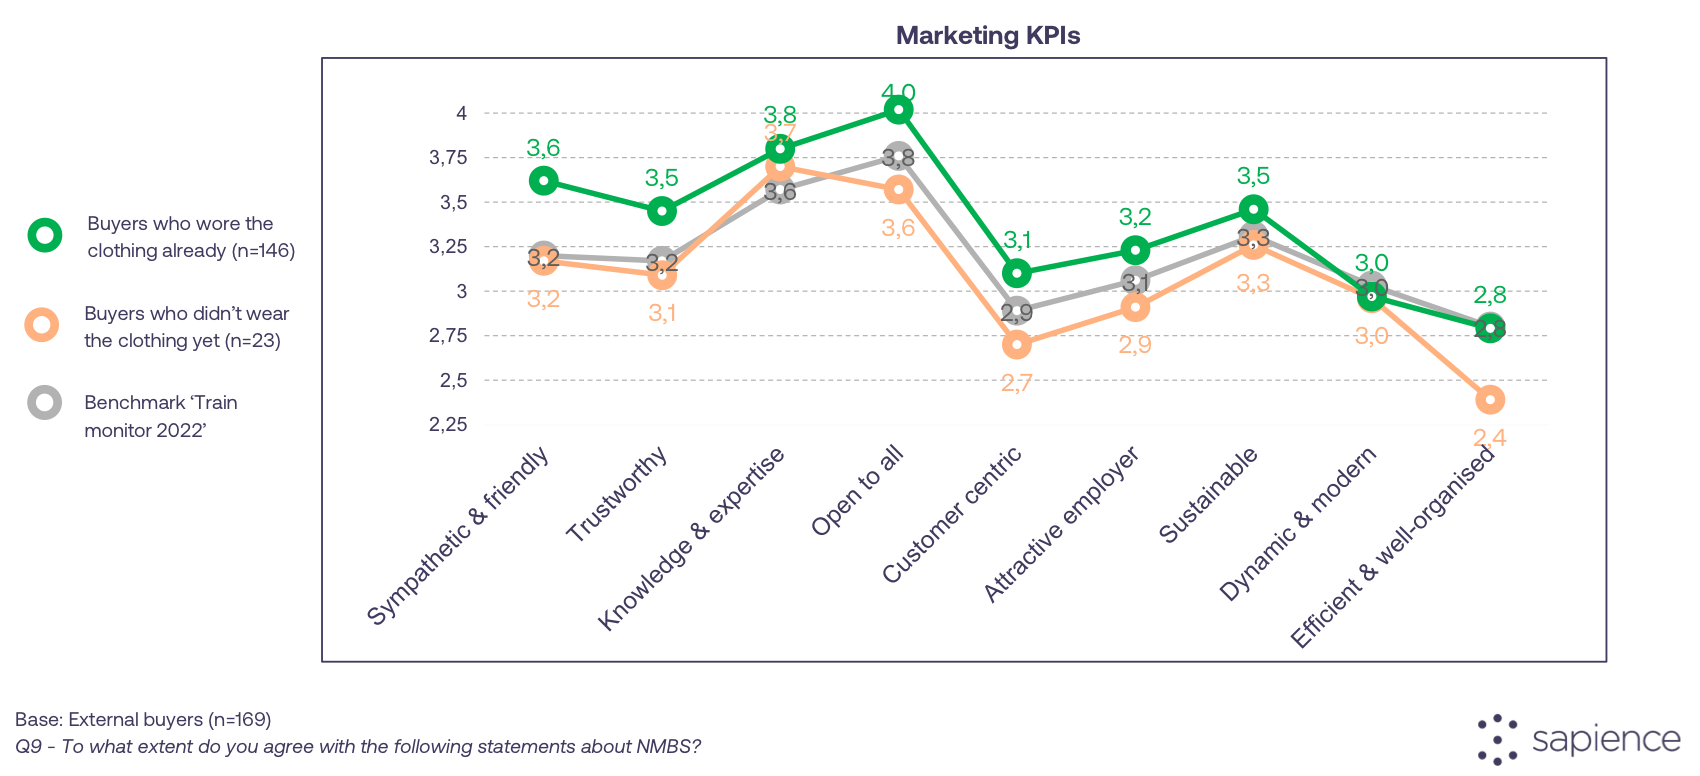
Original chart from the Sapience research report. The wearers, not the buyers, drive the brand image gain.
Buying it helps. Wearing it is what actually moves the brand.
Should you sell company swag or give it away?
One detail of this study deserves its own section, because it quietly reframes the entire economics of company merchandise.
NMBS sold this clothing. It did not give it away.
The collection was offered to employees and to the public at a price. And it still produced a 19% engagement lift, a 26% ambassadorship lift, a 28-point NPS swing and 94% positive word of mouth.
The implication is direct: a company can run a company swag programme at break-even, recovering its production cost through sales, and still capture the full marketing and HR return.
That changes the budget conversation completely. You are no longer asking a CFO to approve a cost. You are asking them to approve a cost-neutral programme that produces measurable brand and retention effects. Merchandise that people choose to pay for also carries a signal that free merchandise never does: someone valued it enough to buy it, which is precisely why they wear it.
What this is worth: a worked model for a 500-person company
Everything above this line is measured. Everything in this section is a model. We are building it from the study's numbers plus stated assumptions, and we are labelling it clearly because a calculation dressed up as a finding is exactly the kind of statistic that has made this industry's numbers untrustworthy.
Here is the arithmetic for a company giving 500 people one good sweater.
The inputs
| Input | Value | Where it comes from |
|---|---|---|
| Recipients | 500 | Assumption |
| Cost per unit | €40 | Assumption, a good sweater |
| Programme cost | €20,000 | Calculated |
| Share who actually wear it | 86% | Study |
| Conversations per wearer, per wearing moment | 1.6 to 3.2 | Study |
| Share of conversations that are positive | 94% | Study |
| Wearing moments per year | 12 | Assumption, once a month, deliberately conservative |
The reach
430 people actually wear the sweater. At twelve wearing moments each, that is 5,160 wearing moments a year.
| Low estimate | High estimate | |
|---|---|---|
| Brand conversations per year | 8,256 | 16,512 |
| Of which positive (94%) | 7,761 | 15,521 |
| Cost per conversation | €2.42 | €1.21 |
What that number is not
A conversation is not an impression, and we are not going to pretend otherwise.
At a €40 CPM, paid social buys you an impression for around four cents. On cost per contact, company swag is roughly thirty to sixty times more expensive, and any merchandise vendor who tells you their channel beats paid media on CPM is comparing two things that are not the same unit.
The honest comparison is to other high-intimacy channels, the ones that also produce a real two-way exchange with a named human being. Events, sponsorships, field marketing and referral programmes typically cost somewhere between €50 and €200 per meaningful conversation once you count staff time. Against those, €1.21 to €2.42 per conversation is very hard to beat, and unlike an event, the programme keeps producing conversations for as long as the sweater survives the wash.
That is the category company swag competes in. Not display advertising.
The retention side, framed as a threshold
We are deliberately not going to claim a retention number. The study measured engagement and satisfaction, not turnover, and converting one into the other requires assumptions we cannot support with this data.
So here is the more useful question. How much retention would this programme need to produce in order to pay for itself?
| Value | |
|---|---|
| Programme cost | €20,000 |
| Cost of replacing one employee | €25,000 to €50,000 (industry benchmark, not a study finding) |
| Employees who need to stay for the programme to break even | 0.4 to 0.8 |
You do not have to believe the 19% engagement lift. You have to believe that giving 500 people a sweater they actually wear stops one single person out of 500 from leaving. If it does, the programme has paid for itself, and every conversation it generated was free.
And if you sell it
Recall that NMBS sold this collection rather than giving it away, and still recorded the full effect.
Run the programme at break-even and the €20,000 comes back. The cost per conversation goes to zero, the retention threshold goes to zero, and the entire return sits on the other side of the ledger. That is the strongest version of this argument, and it is the one the study actually supports.
Assumptions you should stress-test
The model is only as good as its two soft inputs. Change them and see what happens.
- Wearing moments per year. We used twelve. If a sweater gets worn weekly through a Belgian winter, the real number is closer to thirty, and cost per conversation drops below a euro. If it gets worn twice, the model falls apart. Wear rate is the whole thing, which is why the per-item table above matters more than the unit price.
- Cost per unit. A €12 t-shirt looks three times cheaper until you notice it is worn less often. Divide by conversations, not by units.
- Conversations per moment. We used the study's 1.6 to 3.2. That was measured on a highly recognisable national brand in its home market. A low-awareness B2B brand should expect less.
Limitations: what this study does not prove
We are going to be honest about this, because the merch industry has a bad habit of overclaiming and it is the reason nobody believes its numbers.
This study shows correlation, not proven causation. It is a cross-sectional survey, not a randomised experiment. People who choose to buy company swag may already be more engaged employees or more favourable customers. Self-selection is real and we are not going to pretend it is not.
Sapience's own conclusion states it plainly: it is difficult to pinpoint a causal effect.
What pushes it beyond a simple correlation is that the differences are systematic and dose-dependent in two independent directions:
- Effects are stronger for people who have already worn the clothing than for people who only acquired it.
- Effects are stronger for people who chose branded, visible items than for people who chose neutral or non-visible ones.
If the entire result were self-selection, you would expect buyers to score equally high regardless of whether they had worn the item or whether it carried a logo. They did not. The effect tracks with exposure. That is the signature of a real effect, even if it does not close the case.
The ROI section is a model, not a measurement. The reach and retention figures above are built from the study's measured inputs plus assumptions we have stated in full. The conversation counts depend heavily on wearing moments per year, which this study did not measure over a full year. Treat those figures as a framework for your own numbers rather than as findings.
Other limitations worth stating: some sub-group bases are small (n=10 for employees who had not yet worn their clothing, n=23 for external non-wearers), so those specific comparisons are indicative rather than conclusive. The study covers one organisation, in one country, over one year, in a category with a distinctive public sentiment profile. And the employee benchmark dates from 2019, which predates the pandemic-era shifts in workplace sentiment.
What we would do next
Sapience's recommendation, which we fully endorse, is a proper experimental design.
Take two comparable branches or departments of the same organisation. One acts as the control group with no company swag introduced. The other acts as the test group with company swag introduced. Measure both before and after, on the same instruments. That design isolates the causal effect and removes the self-selection problem entirely.
We are actively looking for a partner organisation to run exactly that study. If that is you, we would like to talk.
How to build a company swag programme that works: ten rules
Here is how to translate the findings into a company swag programme that actually produces the effect.
1. Put the logo where people can see it. This is what separates real brand awareness merch from a wasted budget line. The study's clearest design finding is that branded, visible items outperform neutral or hidden-branding items on employee engagement and satisfaction. Chest, back, sleeve, cap front. If your branding is a discreet inside-collar label, you have opted out of the entire word-of-mouth mechanism.
2. Optimise employee swag for wear rate, not for unit cost. Every effect in this study was stronger among people who had actually worn the item. An unworn garment produces exactly zero conversations, zero image lift and zero NPS movement. A €40 sweater worn twenty times outperforms a €12 t-shirt worn once by an enormous margin. Wear rate is the only metric that converts spend into effect.
3. Design it so people want to wear it in their own life. This follows directly from rule 2. The items with the highest wear rates in the NMBS collection were the ones people would plausibly choose to wear anyway: sweaters, Christmas sweaters, t-shirts. Corporate polo shirts that only get worn at trade shows produce trade-show-sized results.
4. Let people pay for it. The practical mechanism is a swag store or an internal company store, where people choose and buy their own items. Selling the collection did not suppress the effect and it changes the internal economics from cost to break-even. It also filters for genuine demand, which is the same thing as filtering for wear rate.
5. Give corporate swag to customers, not only to employees. Treat it as client gifts with a logo people actually want to wear. Two thirds of this study's respondents were external buyers, and the brand image and NPS effects came entirely from that group. Most companies restrict merchandise to staff and leave the entire marketing effect on the table.
6. Count conversations as media. At 1.6 to 3.2 conversations per wearer per wearing moment, a merchandise programme has a calculable reach figure. Put it in your media plan next to your paid channels and compare cost per conversation. It will win more often than you expect.
7. Treat it as employer branding, not procurement. The biggest single number in this study is a 26% lift in ambassadorship, which is an employer branding outcome. If merch sits in procurement and gets bought on unit price, the employer branding return is nobody's job and nobody measures it. Move it to whoever owns employer branding and internal communications.
8. Expect the warmth dimensions to move first. Sympathy, friendliness, trustworthiness and openness moved most. If you are a brand with a competence-heavy, warmth-light perception problem, which describes most utilities, banks, insurers, telcos and transport operators, this channel targets your actual weakness.
9. Measure it against a benchmark you already own. The reason this study is credible is the benchmark. You almost certainly already run an employee engagement survey and some form of brand tracker. Ask two extra questions about company swag in each, and split the results by whether respondents own and wear it. That costs you nothing and gives you your own version of this study.
10. Treat ambassadorship as the target metric. It moved 26%, more than any other engagement sub-factor. If you are building a business case internally, lead with ambassadorship rather than with generic satisfaction. It is the metric where the effect is strongest and the causal story is most intuitive.
Frequently asked questions
Does company swag actually increase employee engagement?
In this study, yes. NMBS employees who acquired company swag scored 8.3 on engagement versus a 7.0 benchmark for the general NMBS employee population, a 19% increase. Satisfaction scored 8.0 versus 6.6, a 21% increase. The study is correlational, but the effect scaled with whether the clothing was actually worn and whether it was visibly branded.
How many people does one piece of branded clothing reach?
Every wearer reached an average of 1.6 to 3.2 additional people per wearing moment through spontaneous conversation. 84% of wearers were addressed by someone about their clothing, and among those who were addressed, the typical conversation involved 2 to 4 people.
Are the conversations positive or negative?
Overwhelmingly positive. 94% of reactions were positive (46% exclusively positive, 48% mainly positive). Negative reactions were close to zero.
Can branded clothing improve Net Promoter Score?
In this study it moved NPS from -27 in the general benchmark population to +1 among external buyers of the company swag, a 28-point swing that crossed from net-detractor to net-promoter territory.
Which brand attributes does company merch improve most?
The warmth attributes. "Sympathetic and friendly" rose 12.5% (3.6 versus a 3.2 benchmark), and trustworthiness, expertise and openness all showed statistically significant gains. Overall brand image rose 4.4%.
Does it matter whether the logo is visible?
Yes, and this was one of the clearest practical findings. Employees who acquired branded, visible clothing scored higher on both engagement and satisfaction than employees who acquired non-branded or non-visible items such as plain socks.
Should we give merchandise away or sell it?
NMBS sold this collection and still recorded the full effect. Selling at break-even lets you recover production cost while keeping the marketing and HR return, and it filters for people who genuinely want the item, which raises wear rate.
Does the study prove causation?
No, and we do not claim it does. It is a cross-sectional survey showing systematic, dose-dependent correlations. Proving causation requires an experimental design with a matched control group, which is the follow-up study Sapience recommended and which we are looking to run.
What is the ROI of company swag?
Using this study's measured inputs and a conservative twelve wearing moments per year, a 500-person programme at €40 per unit generates 8,256 to 16,512 brand conversations annually, at a cost of €1.21 to €2.42 per conversation. On retention, the programme breaks even if it prevents 0.4 to 0.8 departures, meaning a single retained employee out of 500 pays for the whole thing. These are modelled figures built on stated assumptions, not measured findings, and the full working is published in the article.
Is company swag cheaper than advertising?
Not per contact, and be sceptical of anyone who says it is. Paid social buys an impression for around four cents, so swag is roughly thirty to sixty times more expensive per contact. The fair comparison is to other high-intimacy channels such as events, sponsorships and field marketing, which typically run €50 to €200 per meaningful conversation. Against those, company swag is very hard to beat.
Is company swag an employer branding tool or a marketing tool?
Both, and that is the unusual part of this study. The same programme produced a 26% lift in employee ambassadorship and a 28 point NPS swing among customers. Most organisations budget merch as a marketing cost and never measure the employer branding return, which in this data was the larger of the two effects.
Who conducted the research?
The study was designed, fielded and analysed by Sapience, an independent research agency in Ghent, Belgium, in collaboration with the Vrije Universiteit Brussel (VUB). It was commissioned jointly by NMBS/SNCB and Sunday. Sunday did not run the fieldwork or the analysis. Fieldwork ran from 18 to 31 January 2023.
What makes it a scientific study rather than a customer survey?
Four things: it was run by an independent research agency and a university rather than by the merchandise supplier, every result is benchmarked against NMBS's own pre-existing population research ("We Are NMBS 2019" and "Train Monitor 2022") rather than against no comparison group, differences are significance-tested, and the limitations are published alongside the findings.
Is this the first study on branded merchandise?
No, and we do not claim that. Industry research such as ASI's Ad Impressions Study and PPAI's consumer research, along with academic work from the University of Texas at San Antonio and the University of Missouri, has established that promotional products affect recall, brand image and purchase intent. What we believe is new in our study is the combination of three things: it measures HR and marketing effects of the same programme at once, it benchmarks against the client organisation's own internal instruments rather than a general consumer panel, and it studies merchandise that was sold rather than given away.
How large was the sample?
258 respondents in total: 240 complete responses (72 NMBS employees and 168 external buyers) plus 18 partial responses included to maximise feedback. The survey was distributed to approximately 1,600 people who had acquired the 2022 summer and/or winter collection.
What company swag is actually worth
For decades, company clothing has been justified with the vaguest sentence in marketing: "it builds the brand."
This study replaces that sentence with numbers.
Company swag produces measurable, simultaneous returns on three separate lines of a business: word of mouth (84% of wearers spoken to, 94% positively, 1.6 to 3.2 conversations per wearer), human resources (+19% engagement, +21% satisfaction, +26% ambassadorship) and brand marketing (+4.4% brand image, +12.5% on sympathy, NPS from -27 to +1).
It does this at a cost that can be run at break-even. It does this in a category where public sentiment starts negative. And it does this through a mechanism no paid channel can replicate: a real person, who chose your brand, wearing it in front of people who trust them.
The effect is strongest when the clothing is visibly branded and when it is genuinely worn. Which means the job is not to buy merchandise. The job is to make merchandise good enough that people want to put it on.
That is the whole business.
Appendix: the survey questions
We are publishing the question wording so that anyone can replicate this on their own company swag programme. If you run an employee engagement survey and a brand tracker already, these six questions are the entire study.
| Ref | Question | What it measured |
|---|---|---|
| Q2 | How many times have you worn those NMBS clothes? | Wear rate, per item |
| Q3 | Did others address you about your NMBS clothing when you wore it? | Word of mouth reach |
| Q4 | Were the reactions you got to the NMBS clothing...? | Word of mouth sentiment |
| Q7 | To what extent do you agree with the following statements about working at NMBS? | Engagement, satisfaction and the five engagement sub-factors |
| Q9 | To what extent do you agree with the following statements about NMBS? | Brand image and its nine attributes |
| Q10 | How likely would you be to recommend travelling with NMBS trains to others? | Net Promoter Score |
The critical design decision is not in the questions. It is that Q7 reuses the wording of the client's existing employee engagement survey, and Q9 and Q10 reuse the wording of the client's existing brand tracker. That is what makes the benchmark comparison valid rather than decorative. If you change the wording, you lose the benchmark, and without a benchmark you have a testimonial.
The second design decision is the split. Every result is cut by whether the respondent had actually worn the item, and by whether the item carried a visible logo. Those two splits are where the dose-response evidence came from, and they cost nothing to add.
How to cite this study
The Ambassadorship Effect of Company Fashion. Research conducted by Sapience in collaboration with the Vrije Universiteit Brussel (VUB), for NMBS/SNCB and Sunday. Online survey of 258 respondents (240 complete, 18 partial) drawn from approximately 1,600 acquirers of the NMBS 2022 summer and winter company swag collections. Fieldwork 18 to 31 January 2023. Report published February 2023. Employee results benchmarked against "We Are NMBS 2019"; marketing results benchmarked against "Train Monitor 2022".
Journalists, researchers and analysts are welcome to reference these figures with attribution to Sunday, NMBS and Sapience. The full research report is available on request.
About the author and the parties involved
Written by Niels Vandecasteele, founder of Sunday, the merch infrastructure platform that designs, produces and manages branded merchandise programmes for over 4,000 brands across 200+ countries. Sunday commissioned this study and co-funded it with NMBS.
Research by Sapience, an independent research agency based in Ghent, Belgium, in collaboration with the Vrije Universiteit Brussel (VUB). Sapience designed the survey, ran the fieldwork and performed the analysis. Sunday had no role in the fieldwork or the analysis.
Field partner: NMBS/SNCB, the Belgian national railway company, which distributed the survey to its 2022 collection buyers and provided the benchmark data from its own "We Are NMBS 2019" employee survey and "Train Monitor 2022" brand tracker.
Declaration of interest. Sunday sells company swag and therefore has a commercial interest in the outcome of this research. That is why the study was designed and analysed by an independent agency and a university rather than in-house, why it was benchmarked against instruments Sunday had no hand in creating, and why the limitations and the non-significant results are published alongside the wins.
Last reviewed: August 2026. The underlying fieldwork dates from January 2023 and the figures have not been restated.
Want your own version of this study?
We are looking for one partner organisation to run the experimental follow-up: a matched control group and test group, measured before and after, to establish causation properly.
We are also happy to help any company add the two survey questions to its existing engagement survey and brand tracker that would let it produce this analysis internally.
If you are earlier than that and still choosing a supplier, we keep an honest comparison of 26 branded merch platforms, Sunday included.